Every diagram on this site, as a crisp vector file for slides and handouts and as a PNG for anything else. All of them are free to reuse with attribution.
Each image below is the diagram exactly as it appears on its page, redrawn as a standalone file with a white background and no external dependencies. Click a diagram to open the SVG, which scales to any size; use the PNG where a bitmap is required. The text under each one gives the page it comes from, and the description that screen readers hear.
License: Creative Commons Attribution 4.0 (CC BY 4.0)
You may copy, adapt, and redistribute these diagrams, including in slides, handouts, worksheets, videos, and commercial textbooks, provided you credit operantconditioning.com and link to the diagram's page. A line such as "Diagram: operantconditioning.com (CC BY 4.0)" is enough. The license text is at creativecommons.org/licenses/by/4.0.
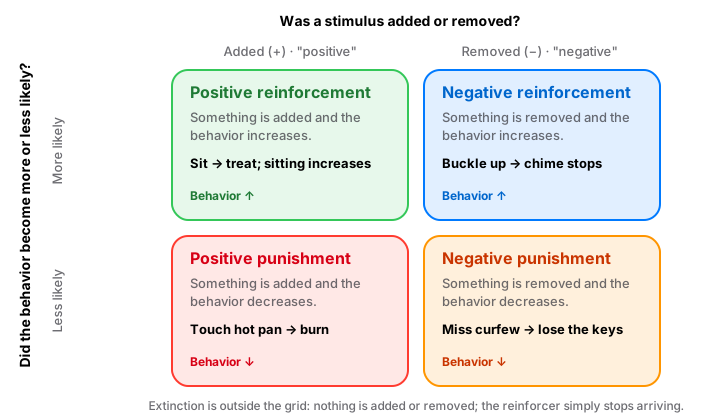
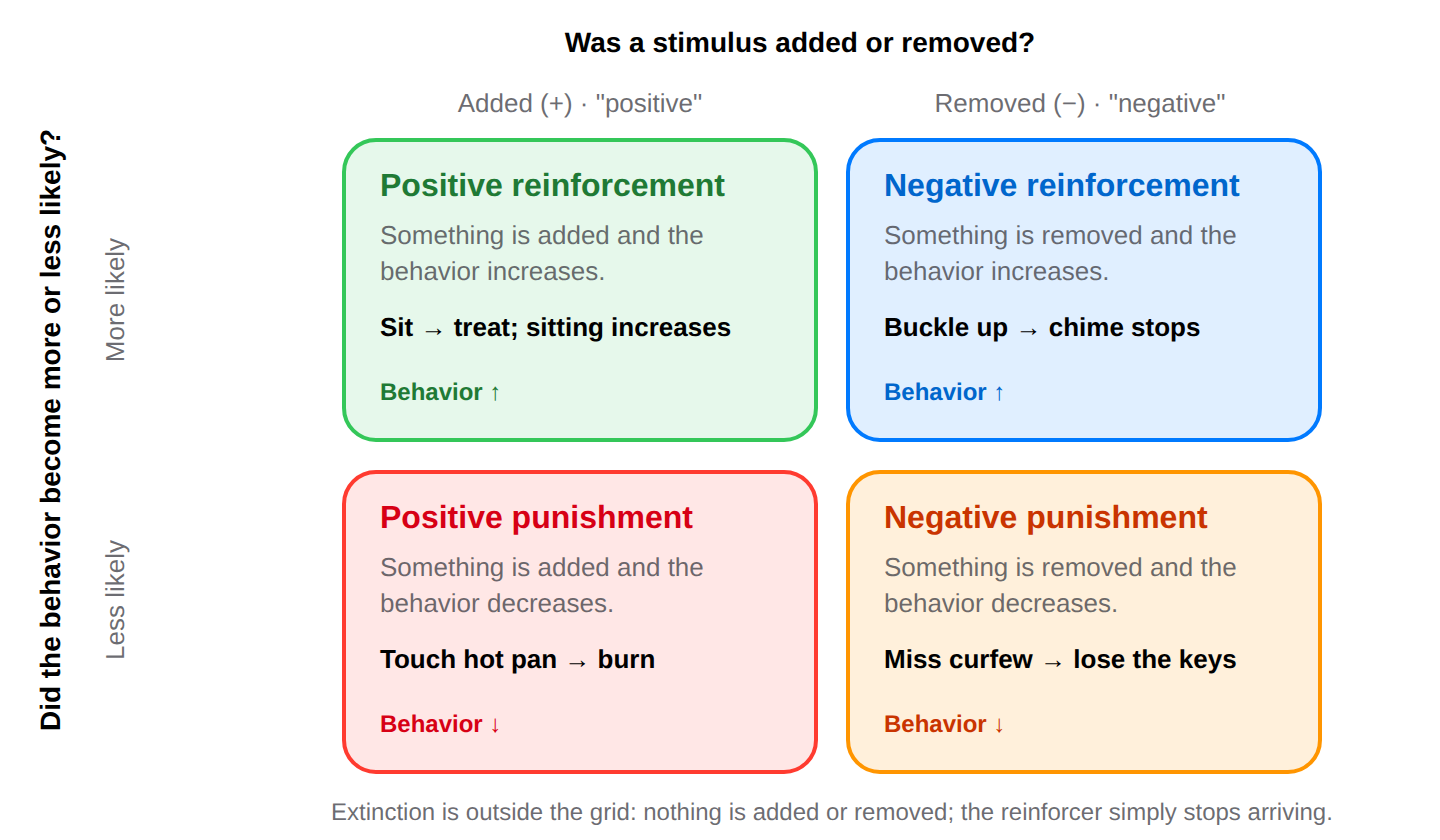
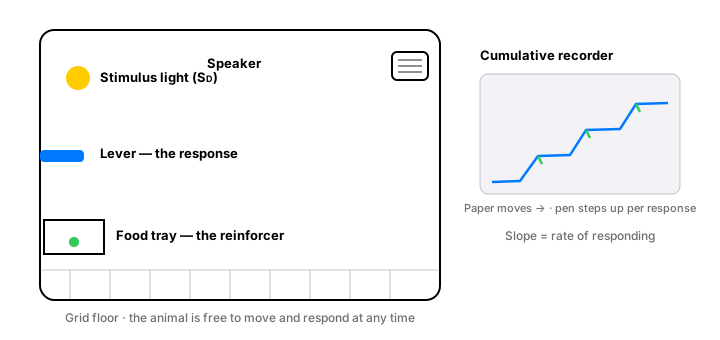
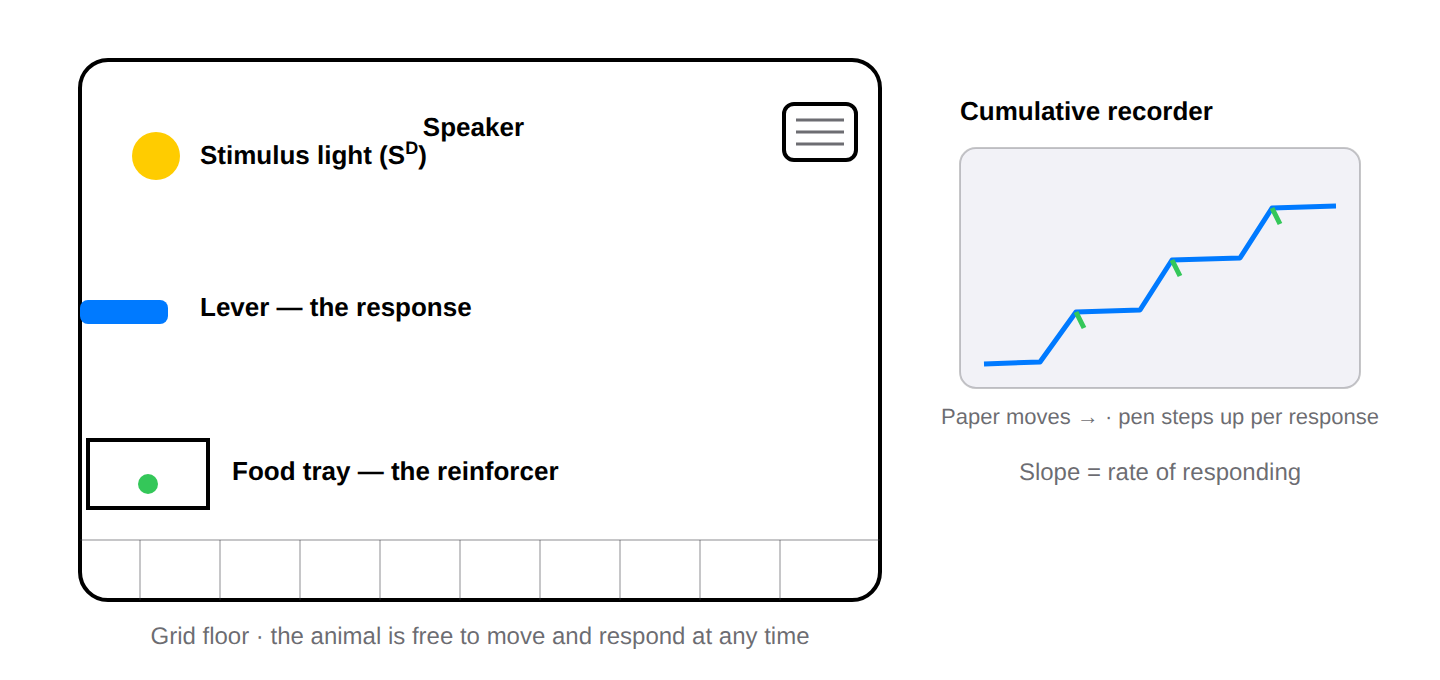
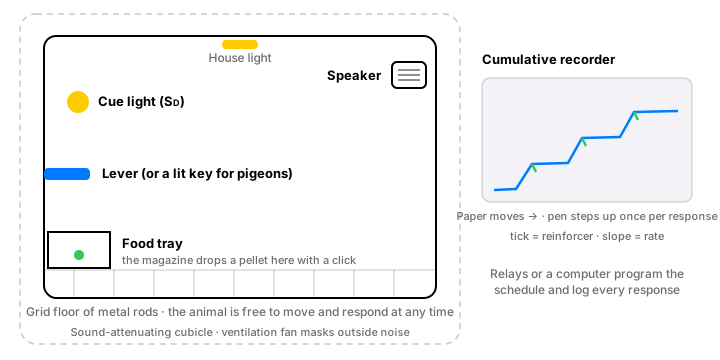
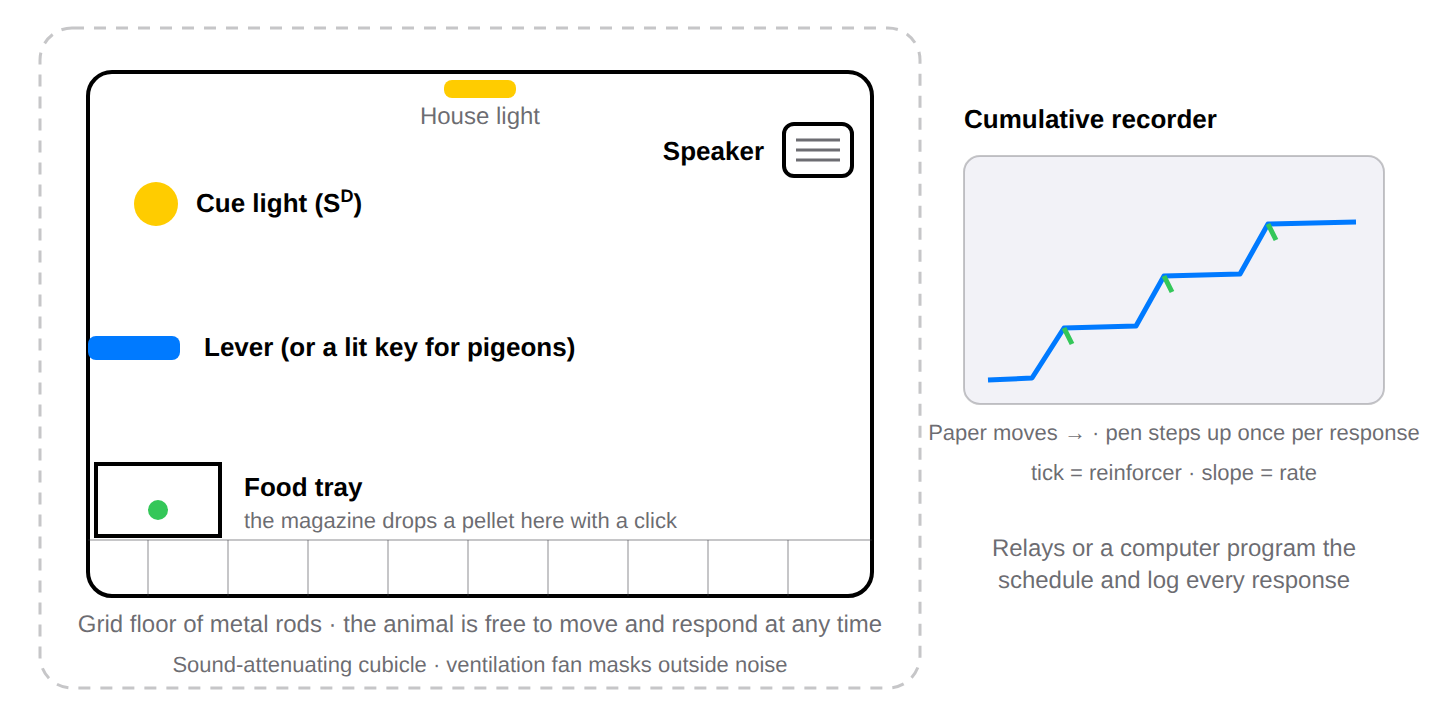
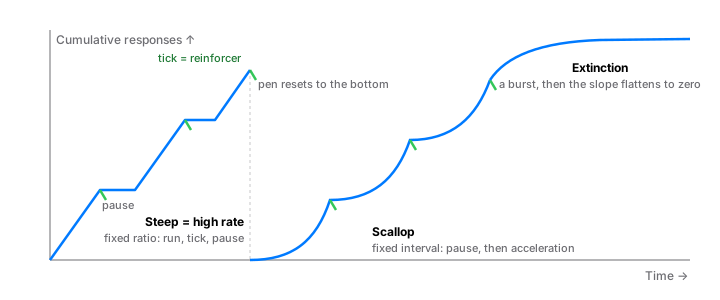
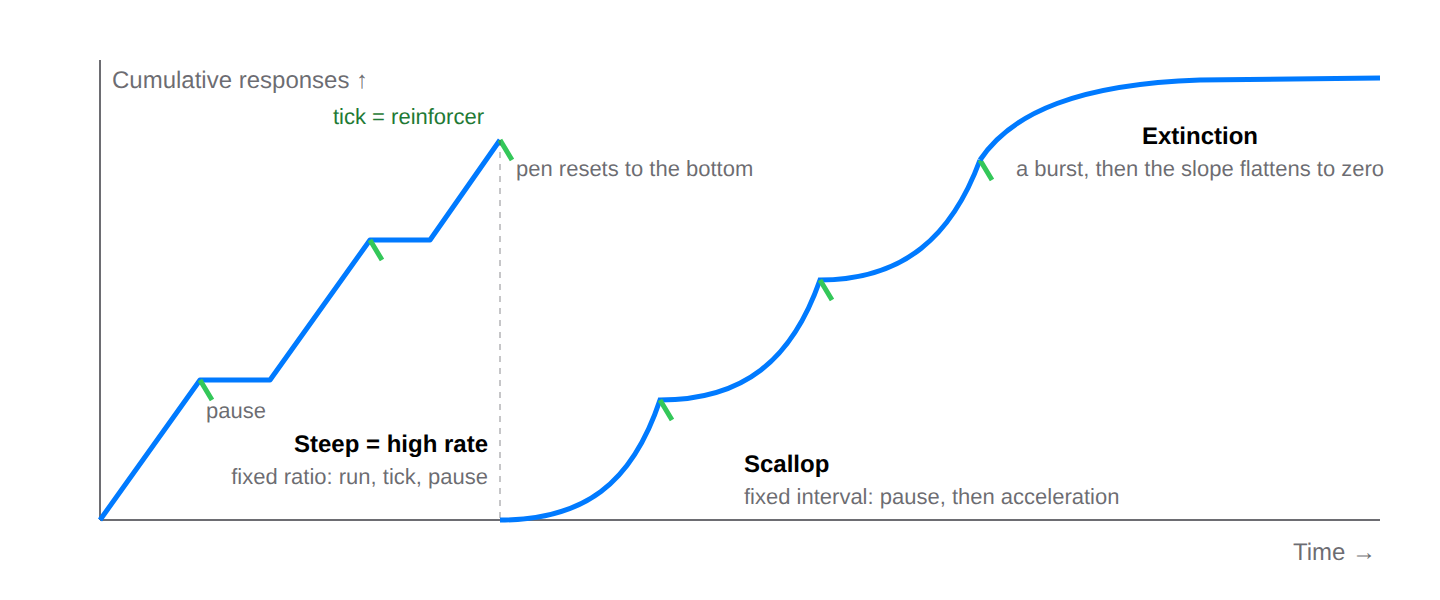
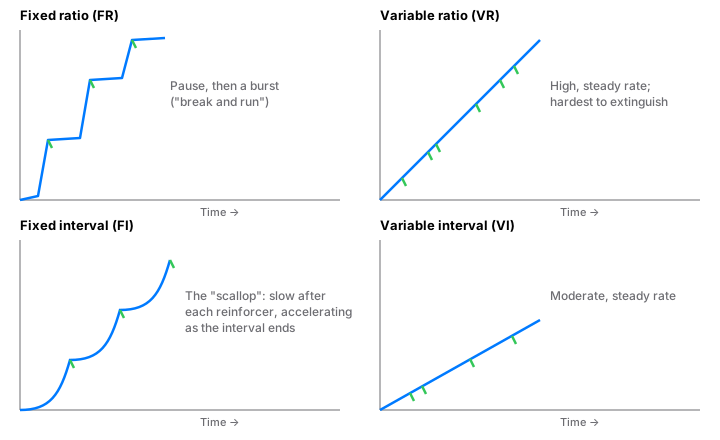
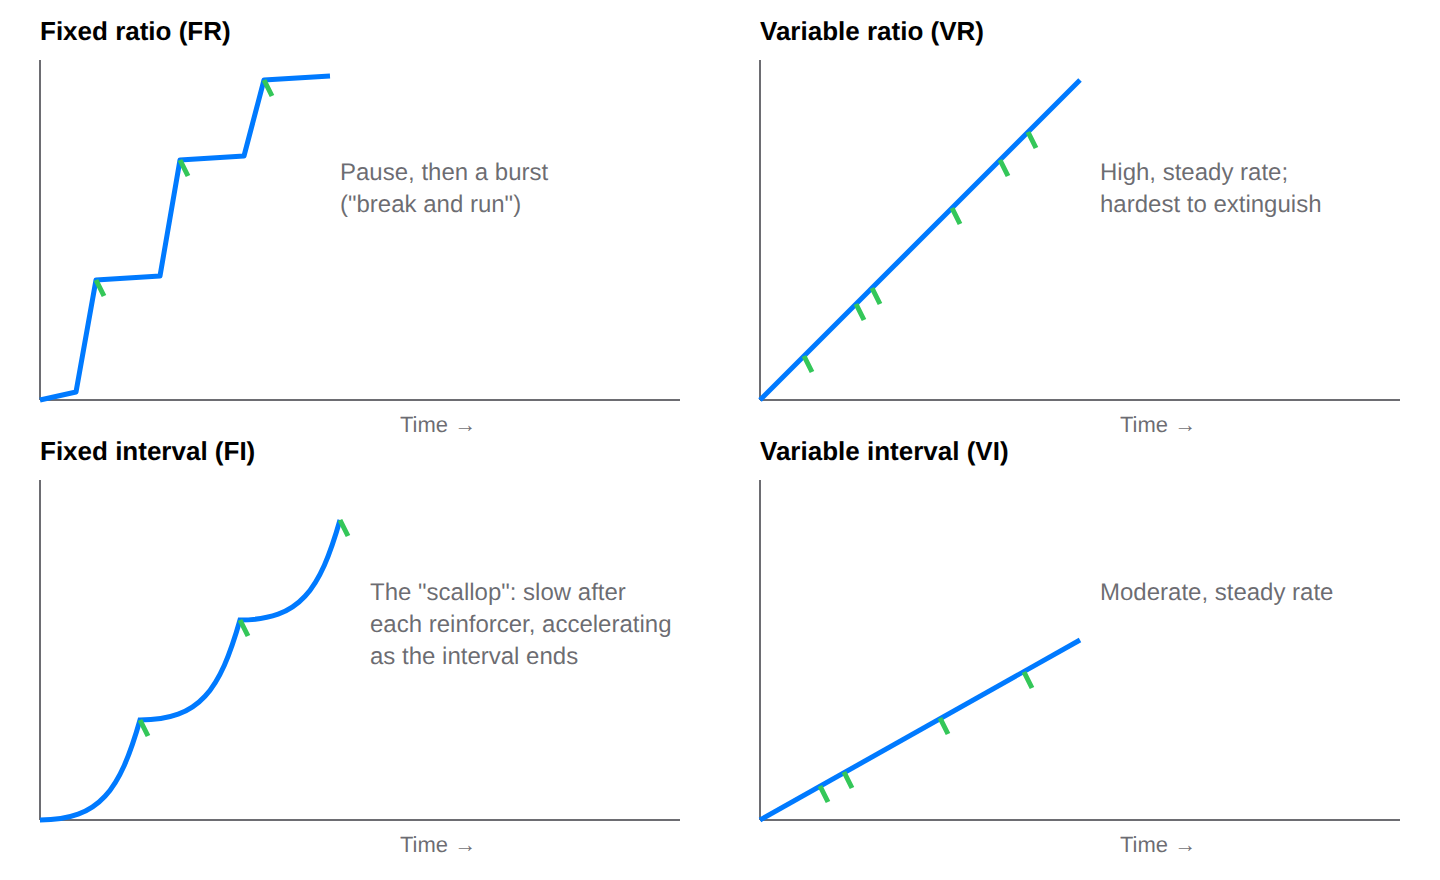
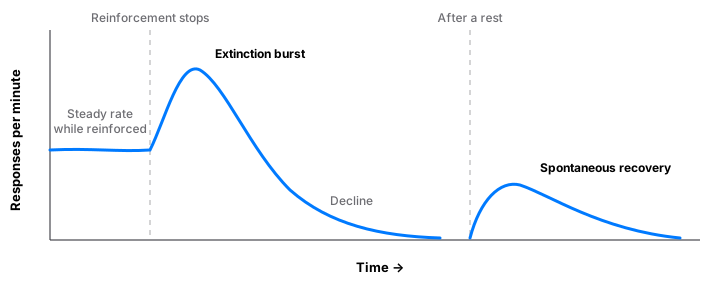
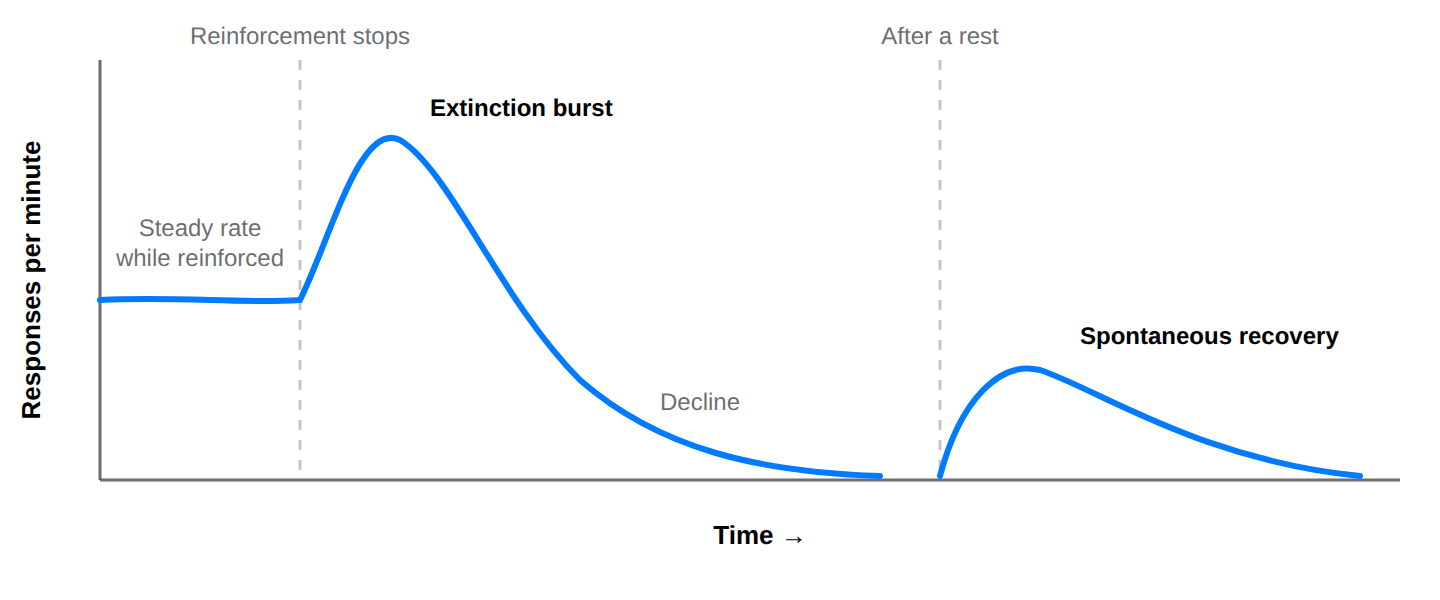
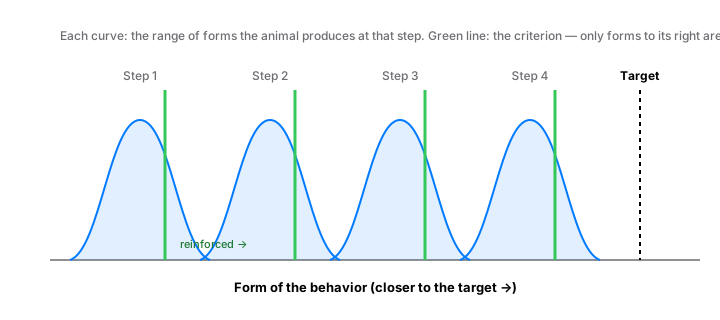
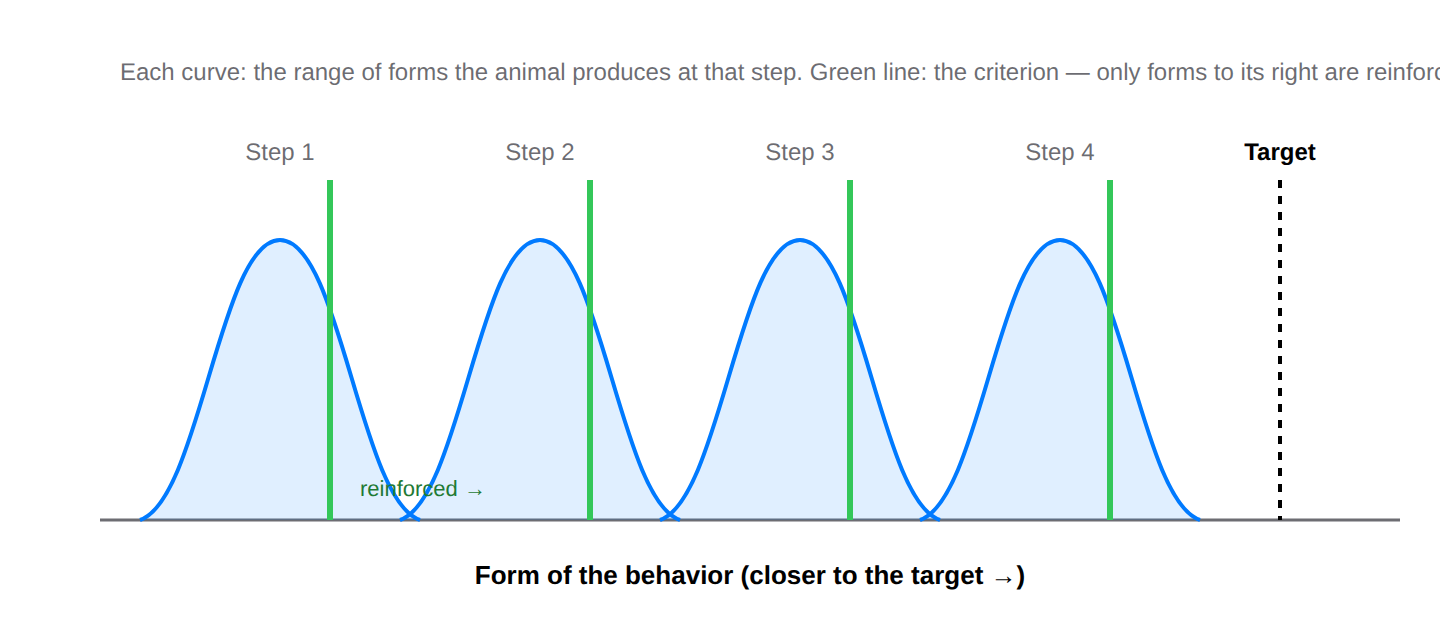
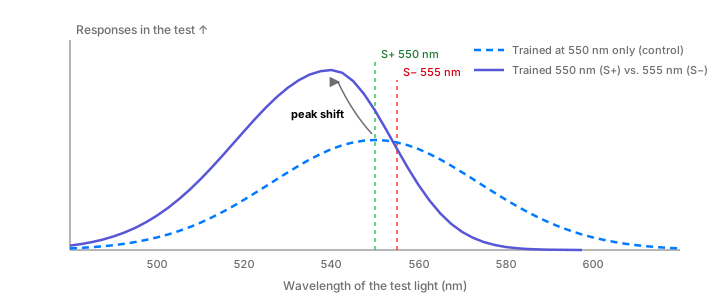
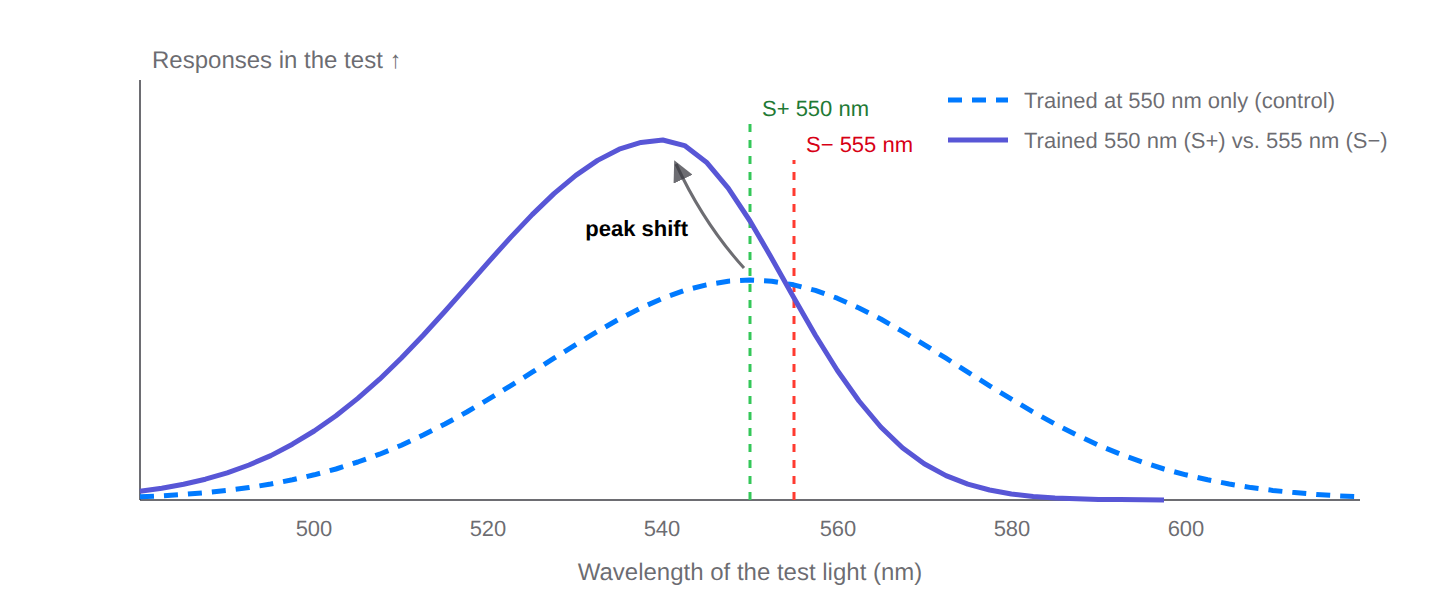
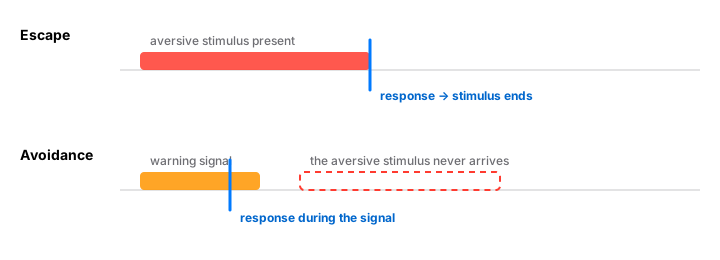
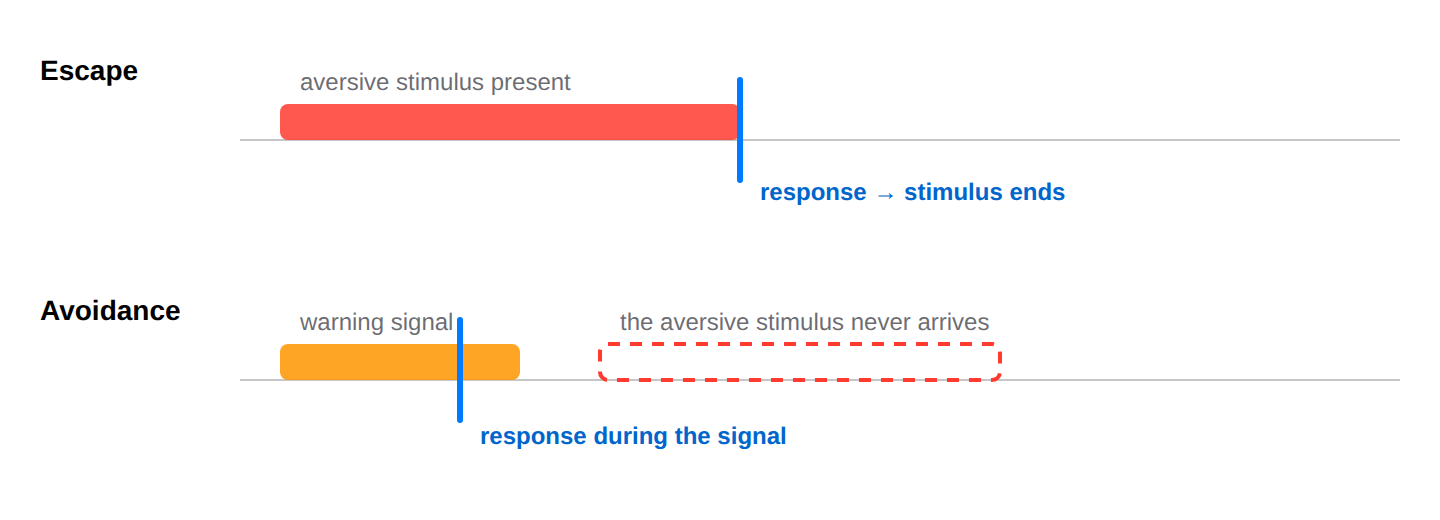
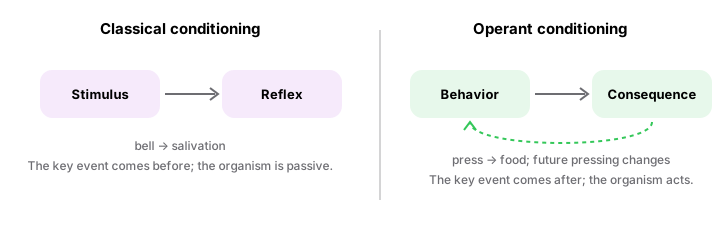
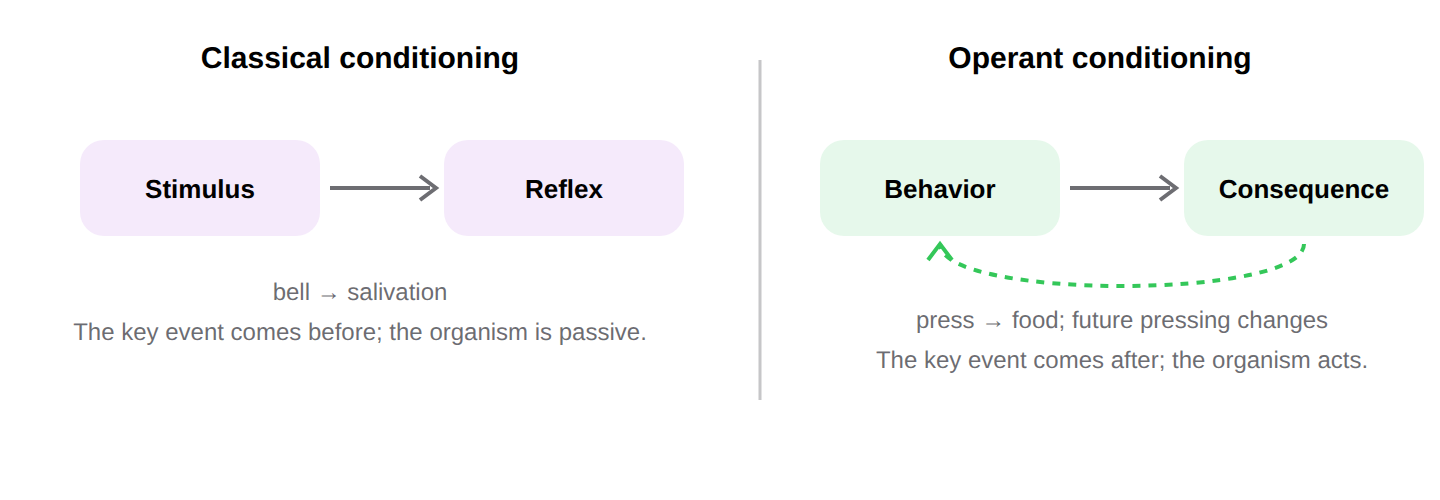
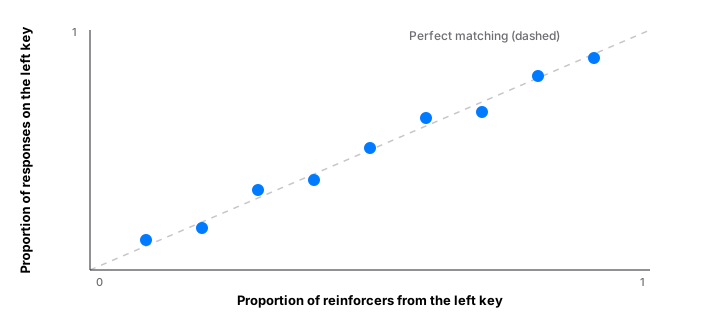
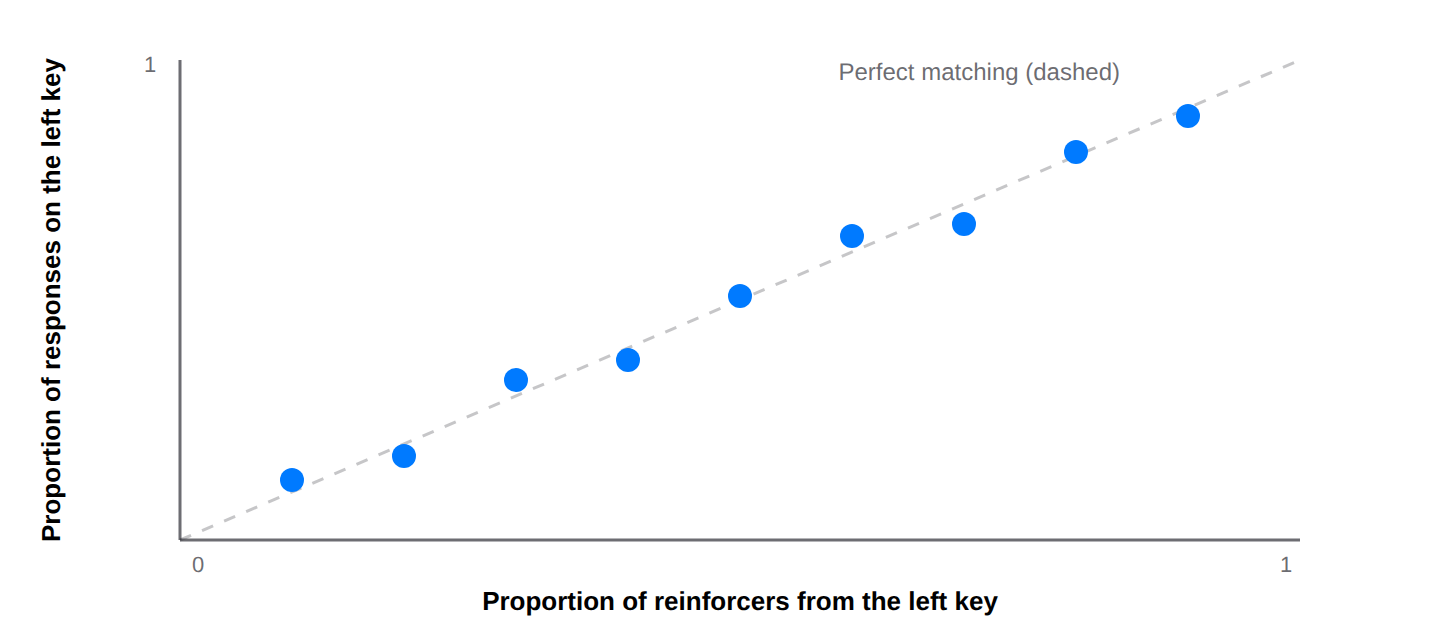
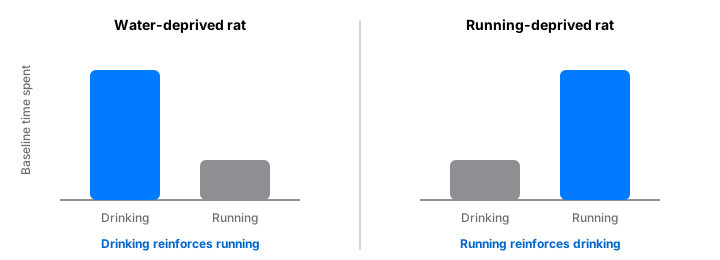
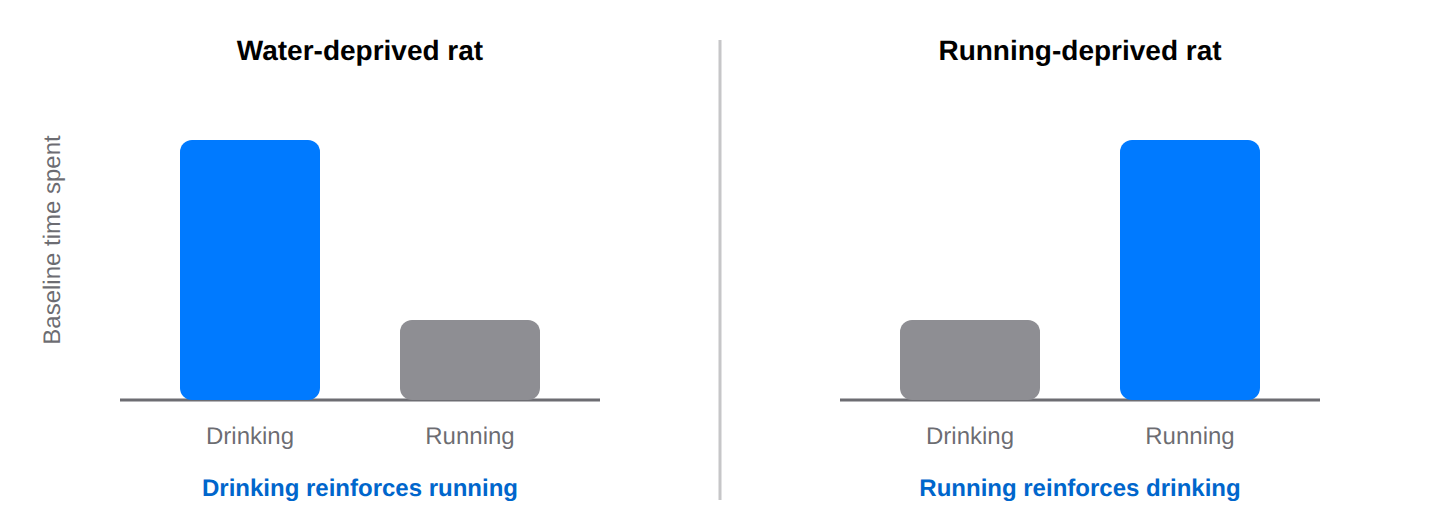
The four quadrants of operant conditioningThe four quadrants. The column answers "added or removed?"; the row answers "more or less likely?" Positive and negative are arithmetic signs, not judgments.From Examples · SVG · PNGSchematic of an operant conditioning chamberAn operant conditioning chamber for a rat. A press on the lever can be programmed to deliver a food pellet on any schedule; the light signals when pressing will pay off; the recorder draws responses over time.From The complete guide · SVG · PNGSchematic of an operant conditioning chamber for a ratAn operant conditioning chamber for a rat. A press on the lever can be programmed to deliver a pellet on any schedule; the cue light signals when pressing will pay off; the recorder draws responses against time.From Skinner Box · SVG · PNGAn annotated cumulative recordReading a cumulative record: slope is rate, ticks are reinforcers, flat stretches are pauses, and the curved "scallop" is the fixed-interval pattern. The line only ever goes up; a behavior that has stopped draws a horizontal line.From Skinner Box · SVG · PNGIdealized cumulative records for the four basic schedulesIdealized cumulative records. Each upward step is a response; green ticks mark reinforcers. Patterns after Ferster & Skinner (1957).From Schedules of Reinforcement · SVG · PNGThe extinction curveThe shape of extinction. When reinforcement stops, responding briefly rises (the burst), then declines; after a rest it returns at a lower level (spontaneous recovery) and fades again.From Extinction · SVG · PNGShaping as a rising criterionShaping as a moving criterion. Reinforcing only the upper tail of what the animal currently does shifts the whole distribution; the criterion is then raised again. Variability (the width of each curve) is what makes the next step possible.From Shaping · SVG · PNGPeak shift after discrimination trainingSchematic of Hanson's result. After discrimination training against a nearby S−, the peak of the gradient moves away from the S− (here from 550 to about 540 nm) and rises above the control gradient.From Stimulus Control · SVG · PNGEscape versus avoidanceEscape ends an aversive stimulus that is present; avoidance prevents one that would have come. Both increase the behavior, so both are negative reinforcement.From Negative Reinforcement · SVG · PNGClassical versus operant conditioning as sequencesThe two kinds of learning as sequences. In classical conditioning a stimulus comes to elicit a reflex; in operant conditioning a consequence changes how often a voluntary behavior recurs.From Operant vs. Classical · SVG · PNGThe matching relationSchematic of the matching relation. Real data cluster around the diagonal; systematic departures from it are captured by the generalized matching law below.From Matching Law · SVG · PNGThe Premack principle as a reversal of baseline probabilitiesPremack's reversal. Whichever behavior is more probable at baseline can reinforce the other; deprivation changes which one that is.From Premack Principle · SVG · PNG
Using the diagrams in teaching
Slides. Drag the SVG into Keynote, PowerPoint, or Google Slides; it stays sharp at any projector size and inherits none of the site's fonts.
Handouts and exams. The extinction curve, the escape-versus-avoidance timeline, and the schedules diagram work as unlabeled prompts: crop the labels and ask students to supply them.
Learning management systems. Use the PNG where the platform will not render SVG. Every SVG carries an accessible description in its <title> and <desc>; the same description appears under each image here, so paste it as the alt text wherever you re-upload.
Attribution. "operantconditioning.com, CC BY 4.0" with a link to the source page satisfies the license.
Want a diagram that is not here? Ask; if it would help other teachers, it will be added to this page.
Frequently asked questions
Can I use these diagrams in a textbook or a course I sell?
Yes. CC BY 4.0 permits commercial use. The only conditions are attribution to operantconditioning.com and a note if you changed the diagram.
Can I edit the diagrams?
Yes. The SVG files are plain text and open in Figma, Illustrator, Inkscape, or any text editor. Adaptations must be credited as adaptations.